Back to work
Dashboard Case Study

Scan Flow

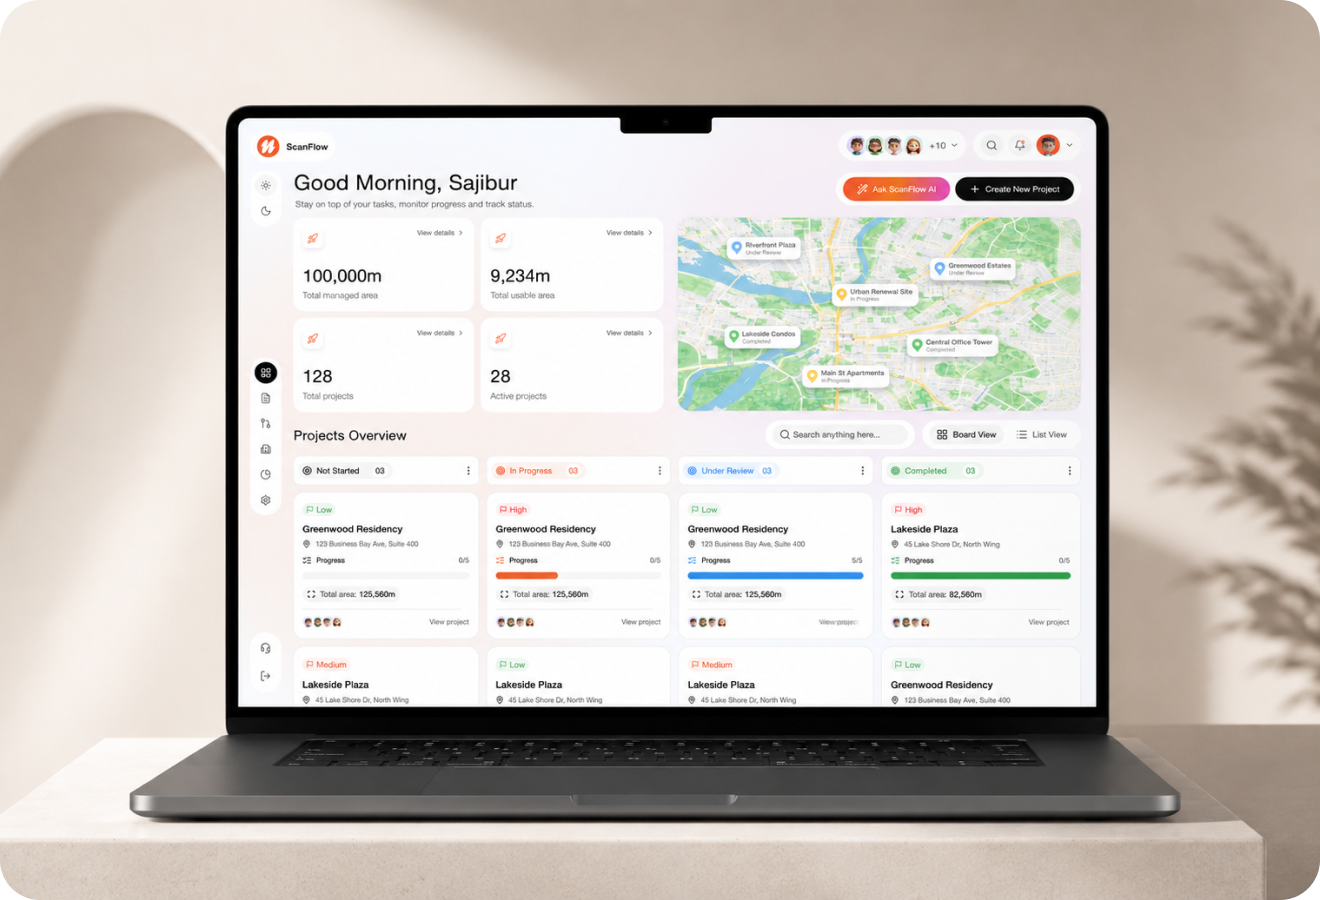
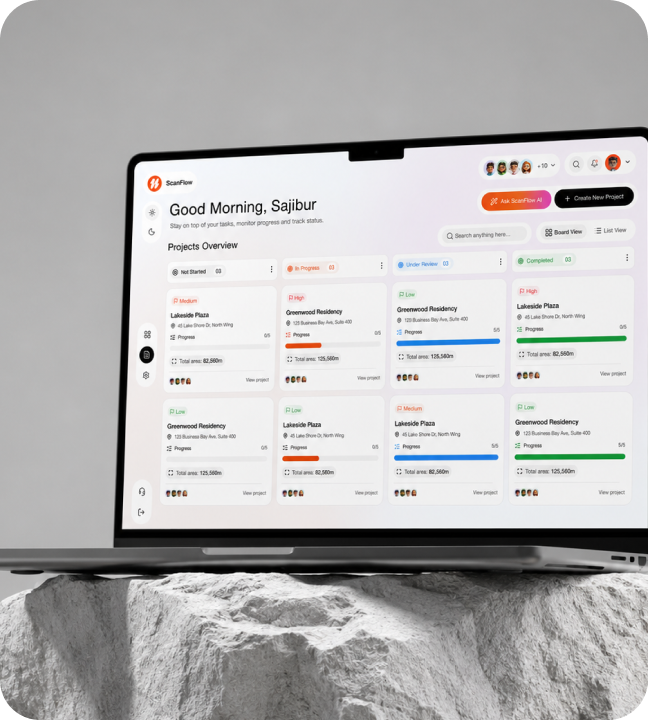
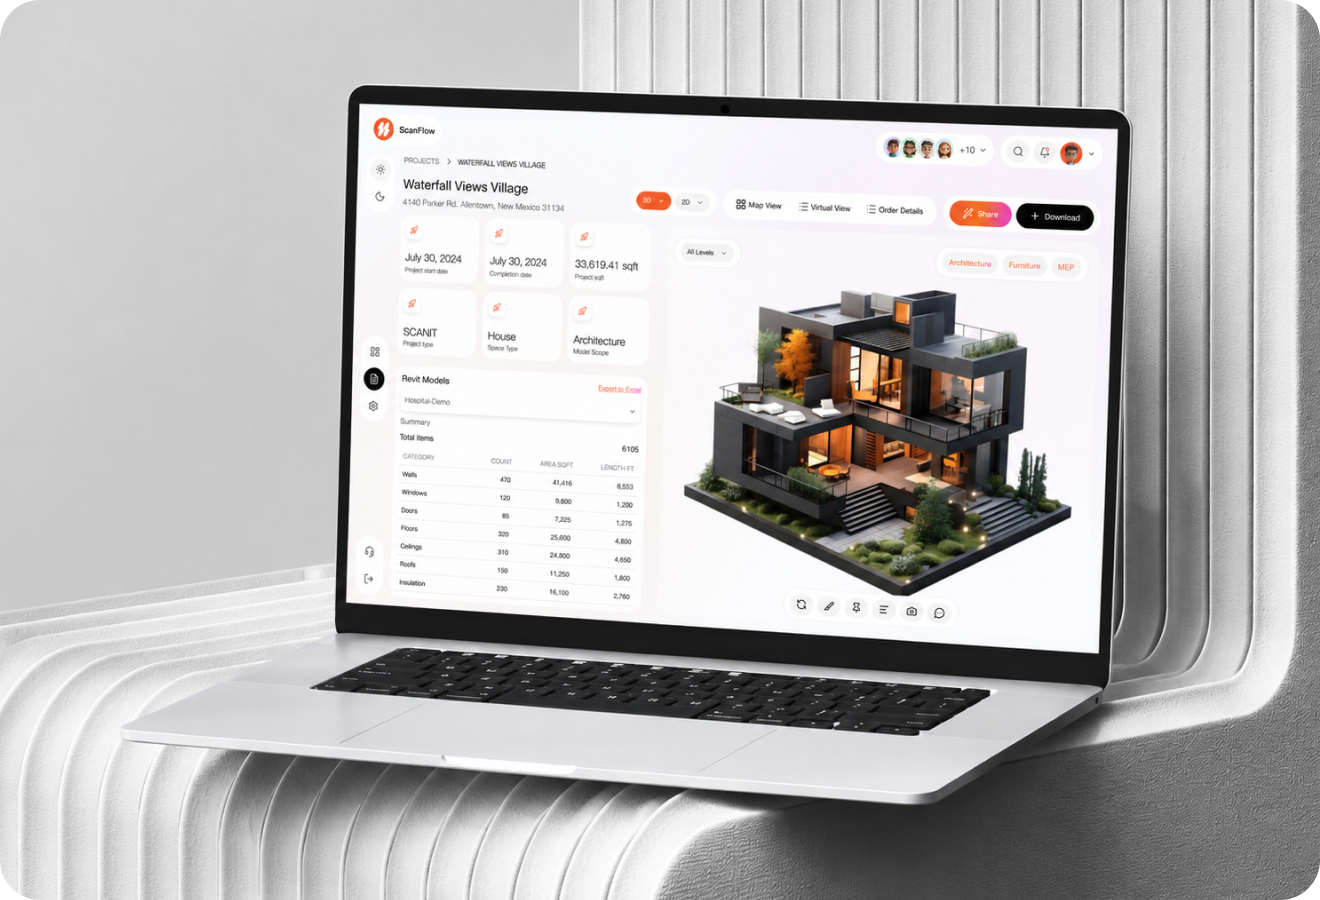
A project tracking dashboard for scan areas, mapped locations, project cards, and active status workflows.

IndustryMappingRoleDashboard UI, operational workflow, status designTimeline3 weeksStatusShippedView Figma
Scan Flow hero mockup
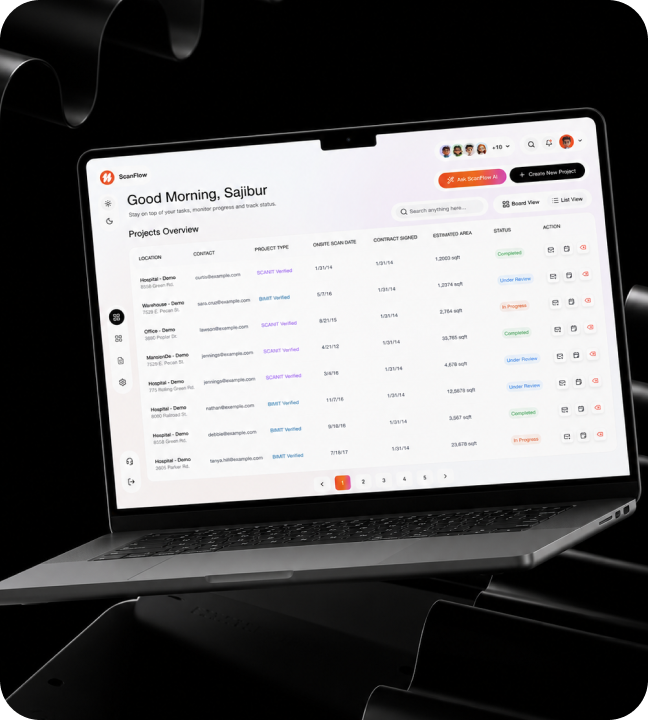
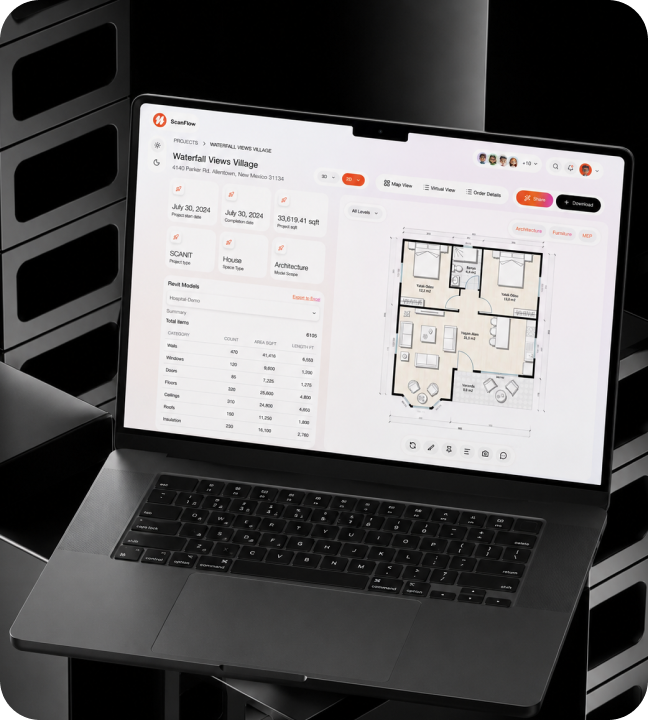
Scan Flow full preview
01

Introduction

Scan Flow is a project tracking dashboard that gives scanning and mapping operations real-time visibility into field activities, data collection progress, and team coordination across multiple project sites. The problem: Field ops rely on spreadsheets, phone calls, and manual updates information is outdated the moment conditions change. What I delivered: • Three-view dashboard: project overview → team tracking → data progress • Real-time status indicators without complex GIS training • 92% data completion rate • Unified view for 15+ active projects
Introduction visual
02

The Challenge

Scanning and mapping operations generate massive data across multiple project sites, field teams, and equipment configurations. Core problems: • Project managers juggle spreadsheets, calls, and manual updates all outdated as soon as field conditions change • No accurate picture of operational progress across active sites • Scheduling conflicts, missed deadlines, and costly data gaps are routine • Existing tools require complex GIS training that field teams don't have What was needed: Real-time visibility into field operations without specialized training or complex software deployment. A dashboard designed for fast-paced operations where conditions change daily.
The Challenge visual
03

Market Context

The scanning and mapping industry is growing rapidly, driven by advances in LiDAR, photogrammetry, and drone technology. Market gap: • Data collection technology has advanced faster than operational software • Most teams still use general-purpose spreadsheets and messaging apps • No purpose-built solution exists for field operations coordination Positioning: Scan Flow fills the gap between advanced data collection tech and the operational tools needed to manage it giving project managers real-time visibility without requiring enterprise software deployment or lengthy training.
Market Context visual
04

The Solution

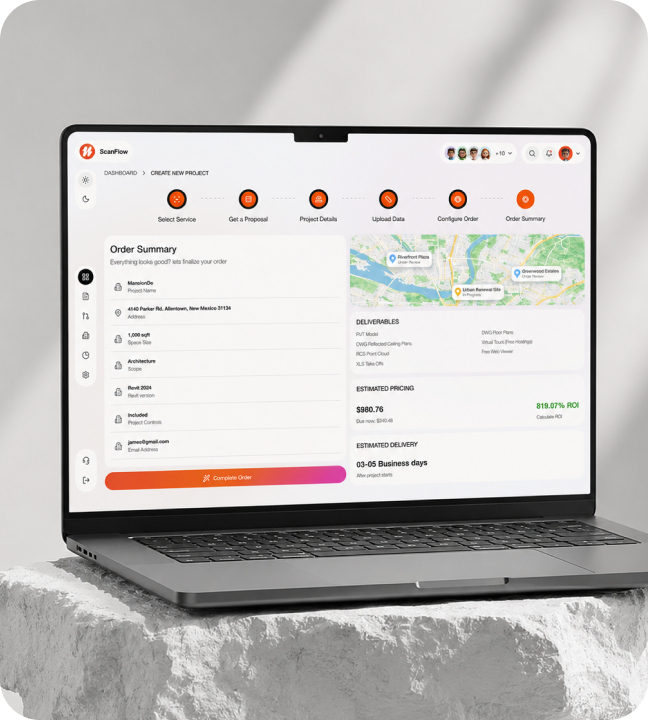
The dashboard is organized around three core operational views: 1. Project Overview: Surfaces active scan areas and completion status. Managers assess the full project picture in seconds during time-sensitive coordination calls. 2. Field Team Tracker: Shows current assignments and equipment status in real time. No more chasing team members for updates. 3. Data Collection Module: Tracks progress against project milestones with clear status indicators, progress bars, and timeline markers. Visual system: Clean, information-dense layout optimized for rapid scanning. Status indicator system uses clear visual tiers that communicate project health without requiring text reading making the dashboard useful during quick standup meetings.
The Solution visual
05

What I Did

I led the full dashboard UX and visual design from operational workflow analysis to high-fidelity interface screens. My contributions: • Mapped scanning operations workflows to design the three-view layout matching how projects actually run • Developed the status indicator system visual tiers communicate project health without text reading • Balanced information density with scanability ops managers assess the full picture in seconds • Designed for daily standups and weekly reviews the dashboard works in a meeting context, not just at a desk Outcome: A dashboard that replaces complex spreadsheets without sacrificing the detail field teams need to execute their work effectively.
What I Did visual
06

Impact

Scan Flow transformed how field operations teams coordinate scanning projects. Key results: • 15+ active scan projects managed from a single view • 8 field teams coordinated in real time • 4 scan area zones tracked simultaneously • 92% data completion rate fewer gaps and missed collections • 3 project status tiers provide clear operational picture Business impact: Scheduling conflicts reduced significantly. Project managers spend less time chasing updates and more time optimizing operations. The dashboard became the central coordination tool for daily standups and weekly reviews proving purpose-built operational dashboards can replace complex spreadsheet systems.
Impact visual
15+Active scan projects8Field teams4Scan area zones92%Data completion rate3Project status tiers1Operations command view
Let's work together

Have a project in mind?

I'm available for focused UI/UX projects, product redesigns, and design systems. Let's build something that stands out.

Next Case Study

Grid Craft

A refined creative studio landing page that balances visual ambition with clear service communication.

Open Next